PlantScope
A handy vegetation index visualization application
Quick Guide
Quick Guide
Overview
PlantScope is an easy-to-use application that calculates and analyzes a numerical value called the “Vegetation Index” which represents the health of crops, forests, green spaces, and other plants, based on images of fields and other locations, and displays it as an image.
In addition to drone images and camera-based images, aerial photos taken by satellites can also be used.
Highly accurate vegetation index images can be obtained by using multispectral images taken by satellite images or drones equipped with dedicated cameras. It also supports vegetation indices obtained from ordinary images (RGB images). This tool can be easily used by those involved in agriculture and forestry, as well as in educational settings.

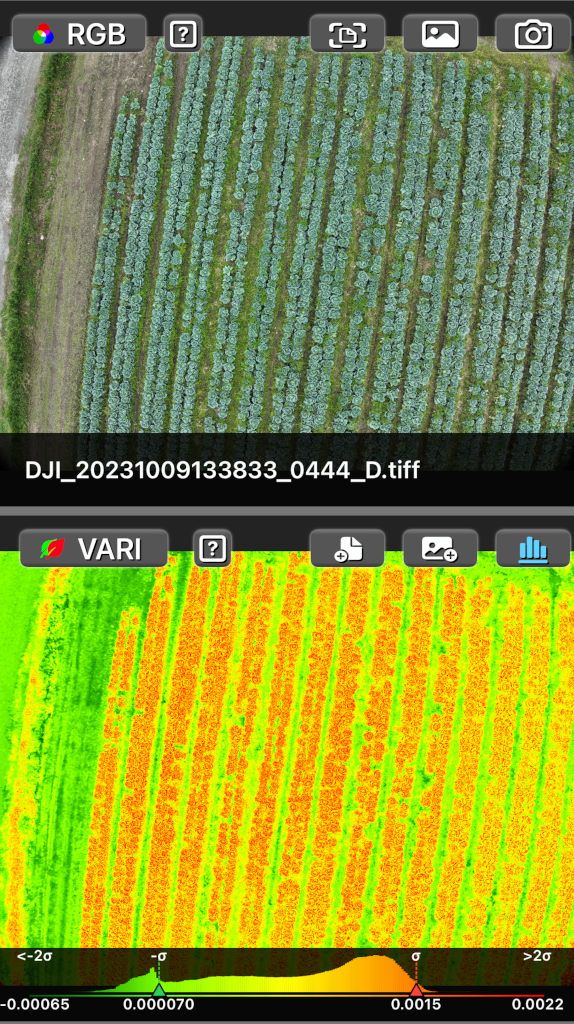
The screen is divided into two parts, up and down or left and right, with one side displaying the source image and the other side displaying the vegetation index visualization image generated from the source image.
Source Image
Select image source type

Switches the source image type between RGB and Multispectral images.
“RGB” image source type
Calculate vegetation index and create image using RGB image source. Common image file formats, Jpeg, Png, Heic, Heif and Tiff are available.
File select button

Select and load an RGB image file using the file browser.
Photos library select button

Select and load an RGB image file using the photos library.
Camera button

Capture RGB image using the rear camera.

Toggles camera preview frame size.

Shutter release button with current zoom ratio.\nZoom ratio can be changed by pinching in and out on the screen.

Resets the zoom ratio to 1.0.
“Multispectrum” image source type
Calculate vegetation index and create image using multispectral image sources. Common image file formats, Jpeg, Png, Heic, Heif and Tiff are available.
Each spectral channel file must have one gray channel. For red, green, blue band, RGB image file is also available.
Application does not check whether the selected file has the correct channel data. All the channel data must be the same geo location, pixel width/height, and number of total pixels.
You can select up to 5 bands of files, but you only need to specify the required band for each vegetation index, not necessarily all of them.

Select Near Infra-Red band file

Select Red Edge band file

Select RED band file

Select Green band file

Select Blue band file

Clear selected files
Vegetation Index
Select the type of vegetation index
VI type menu
RGB

Multispectrum

Switches the VI image type
File save button

Save VI image file to disk/cloud.
Photo save button

Store VI image to on photos library.
Histogram toggle button

Show/Hide VI histogram chart.
Vegetation Index types
VI Type and formula
Four types in RGB mode, and seven types in multispectrum mode are available.
[Multispectrum]
VARI:
Visible Atmospherically Resistant Index

GRVI:
Green Red Vegetation Index

RGBVI:
Red Green Blue Vegetation Index

TGI:
Triangular Greenness Index

[Multispectrum]
NDVI:
Normalized Difference Vegetation Index

NDRE:
Normalized Difference Red Edge Index

GNDVI:
Green Normalized Difference Vegetation Index

BNDVI:
Blue Normalized Difference Vegetation Index

SIPI2:
Structure Insensitive Pigment Index

LCI:
Leaf Chlorophyll Index

MCARI:
Modified Chlorophyll Absorption in Reflective Index

Histogram
When the histogram switch is turned on, a histogram chart is generated from the VI image, showing the probability distribution of occurrence for each color.

Histogram’s x-axis value is limited between -2 * σ and 2 * σ, where σ is the standard deviation of the VI data.
Since Vi data is normalized -1.0 to 1.0 and does not necessarily follow a normal distribution, there can be cases where the sigma is outside the histogram data range.
VI generation tends to consume more power and generate more heat in the smartphone device. Please refrain from using camera mode with VI and histogram for long periods of time.
(c) 2024 Takatsuya Giken, Co., Ltd.
Inquiries support@takatsuya.jp
If you have any questions, requests for new features, improvements, or bug report, please submit it using this form.

