
PlantScope
植生指数可視化アプリケーション
クイックガイド
プライバシーポリシー
このアプリケーションを通して弊社 (高津屋技研株式会社) がお客様のいかなる個人情報も収集することはありません。
スマートフォン・タブレットを使用してお客様が入力した情報はデバイスのお客様専用フォルダ、またはクラウドに保存される場合がありますが、弊社を含む第三者がこれらにアクセスすることはできません。
スマートフォンやタブレット端末等の共有機能を通じて外部に送信または保存する場合は、ご自身の判断と責任において管理いただきますようお願いいたします。
本アプリケーションを含む当社のアプリケーションおよびサービスにおける個人情報の取り扱いに関するプライバシーポリシーは、以下のリンクをご参照ください。
クイックガイド
概要
PlantScopeは、圃場等の画像を元に、農作物、森林、緑地などの植物の健康状態を表す「植生指数(Vegetation Index)」と呼ばれる数値を計算・分析し、画像として表示する、簡単に利用いただけるアプリケーションです。
ドローン映像やカメラを使用した画像の他、人工衛星が撮影した航空写真などが利用できます。
人工衛星画像や専用カメラ搭載ドローンなどで撮影したマルチスペクトル画像を使用すると、高精度の植生指数映像が得られます。また通常の画像(RGB画像)で得られる植生指数にも対応しています。農業・林業に携わる方、教育現場などで気軽に利用いただけるツールです。
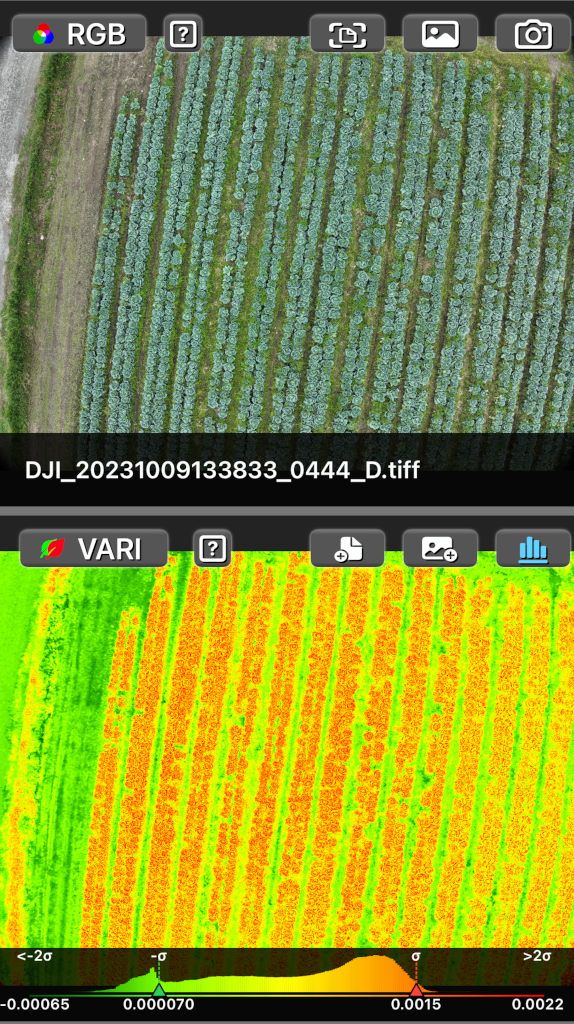
画面は上下または左右に2分割され、一方にはソース画像が、もう一方にはソース画像から生成された植生指数の可視化画像が表示されます。
ソース画像
画像タイプの選択
ソース画像のタイプを RGB 画像とマルチスペクトル画像の間で切り替えます。
“RGB” 画像
通常のデジタルカメラで撮影できるRGB画像を使用して植生指数を計算し、画像を作成します。一般的な画像ファイル形式、Jpeg、Png、Heic、Heif、Tiffが利用できます。
ファイル選択ボタン

ファイルブラウザを使用してRGB画像ファイルを選択し、読み込みます。
フォトライブラリ選択ボタン

フォトライブラリからRGB画像を選択し、読み込みます。
Camera button

Capture RGB image using the rear camera.

Toggles camera preview frame size.

Shutter release button with current zoom ratio.\nZoom ratio can be changed by pinching in and out on the screen.

Resets the zoom ratio to 1.0.
“マルチスペクトル(Multispectrum)” 画像
マルチスペクトル画像ソースを使用して植生指数を計算し、画像を作成します。一般的な画像ファイル形式、Jpeg、Png、Heic、Heif、Tiffが利用可能です。
各スペクトルバンドのファイルは、それぞれ単一のグレーチャンネルを持っている必要があります。赤、緑、青のバンドについては、RGB画像ファイルも利用可能です。
アプリケーションは、選択されたファイルが正しいバンドのデータを持っているかどうかをチェックしません。例えば、NIR(近赤外線)バンドに赤色バンドのファイルを指定しても、アプリケーションはエラーや警告を発生しませんのでご留意ください。
すべてのチャンネルデータは、同じピクセル幅/高さ、合計ピクセル数でなければならなず、ファイル間で異なる場合は植生指数を生成しません。これらが同じ場合は植生指数を生成しますが、地理的位置や撮影時間、撮影範囲、撮影高度などが異なる場合は正しい植生指数は生成されません。必ず同一システム・機器が同時に生成したマルチスペクトル画像を使用ください。
最大5つのバンドのファイルが選択できますが、植生指数毎に必要なバンドを指定するだけでよく、必ずしも全て選択する必要ありません。

近赤外線(Near Infra-Red)バンドのファイル選択

レッドエッジ(Red Edge)バンドのファイル選択

赤色バンドのファイル選択

緑色バンドのファイル選択

青色バンドのファイル選択

選択したファイルの解除
植生指数(Vegetation Index)
植生指数タイプの選択
植生指数選択メニュー
植生指数タイプの切り替えメニュ
RGB
Multispectrum
ファイル保存ボタン

植生指数画像ファイルを端末やクラウドに保存します。
フォトライブラリ保存ボタン

植生指数画像をフォトライブラリに保存します。
ヒストグラム表示切り替えボタン
ヒストグラム(植生指数の値の大小ごとの頻度グラフ)の表示・非表示を切り替えます。
植生指数タイプ
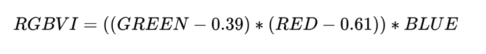
植生指数タイプと計算式
RGBモードでは4つ, マルチスペクトルモードでは7つのタイプが利用できます。
[RGB]
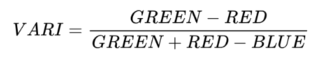
VARI:
Visible Atmospherically Resistant Index
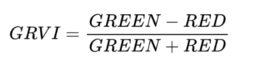
GRVI:
Green Red Vegetation Index
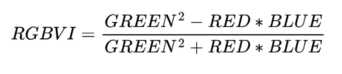
RGBVI:
Red Green Blue Vegetation Index
TGI:
Triangular Greenness Index
[Multispectrum]
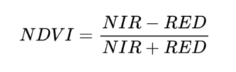
NDVI:
Normalized Difference Vegetation Index
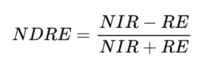
NDRE:
Normalized Difference Red Edge Index
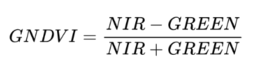
GNDVI:
Green Normalized Difference Vegetation Index
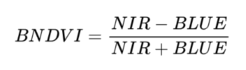
BNDVI:
Blue Normalized Difference Vegetation Index
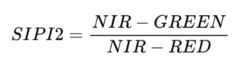
SIPI2:
Structure Insensitive Pigment Index
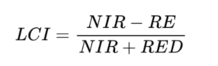
LCI:
Leaf Chlorophyll Index
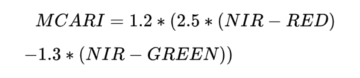
MCARI:
Modified Chlorophyll Absorption in Reflective Index
ヒストグラム
ヒストグラム表示切り替えボタンで表示オンにすると、植生指数画像からヒストグラムチャートを生成し表示します。
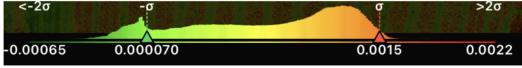
植生指数は-1から-1の値になるよう正規化が行われていますが、視覚的に分布が分かりやすいようにX軸の値が (標準偏差x4)の幅の範囲に入るよう表示しています。
植生指数の分布は必ずしも標準正規分布に従うわけではなく、特に画像内に人工物が多く入る場合は複数のピークが現れることがよくあります。計算上、標準偏差の値が指数の範囲を超える場合もあり得ますのでご留意ください。
植生指数とその画像の生成、表示は多くの端末電力を消費し、端末の温度が高くなる傾向があります。特にカメラのプレビューの長時間利用時はご注意ください。
(c) 2024 高津屋技研株式会社
お問い合わせ
フォーム お問い合わせフォーム